Data Preparation
Statistisk sentralbyrå (SSB) is the Norwegian statistics bureau, it publishes about 1000 new statistical releases every year on its web site. In this practice we are examing the household income dataset per municipality, and visualize it on the map to see which municipality makes highest median income per household.
import pandas as pd
import warnings
warnings.filterwarnings('ignore')
data = pd.read_csv('https://data.ssb.no/api/v0/dataset/49678.csv?lang=no', encoding = 'iso-8859-1', delimiter = ';')
# Only select data in 2022.
data_2022 = data[data['år'] == 2022]
data_2022.head()| region | husholdningstype | statistikkvariabel | år | 06944: Inntekt for husholdninger, etter region, husholdningstype, statistikkvariabel og år | |
|---|---|---|---|---|---|
| 17 | 3001 Halden (2020-2023) | 0000 Alle husholdninger | Samlet inntekt, median (kr) | 2022 | 674000 |
| 35 | 3001 Halden (2020-2023) | 0000 Alle husholdninger | Inntekt etter skatt, median (kr) | 2022 | 544000 |
| 53 | 3001 Halden (2020-2023) | 0000 Alle husholdninger | Antall husholdninger | 2022 | 15094 |
| 71 | 3001 Halden (2020-2023) | 0001 Aleneboende | Samlet inntekt, median (kr) | 2022 | 381000 |
| 89 | 3001 Halden (2020-2023) | 0001 Aleneboende | Inntekt etter skatt, median (kr) | 2022 | 312000 |
# Select total income for whole household
data_2022_allhousehold = data_2022[data['husholdningstype'] == '0000 Alle husholdninger']
data_2022_allhousehold_totalincome = data_2022_allhousehold[data_2022_allhousehold['statistikkvariabel'] == 'Samlet inntekt, median (kr)']
data_2022_allhousehold_totalincome.head()| region | husholdningstype | statistikkvariabel | år | 06944: Inntekt for husholdninger, etter region, husholdningstype, statistikkvariabel og år | |
|---|---|---|---|---|---|
| 17 | 3001 Halden (2020-2023) | 0000 Alle husholdninger | Samlet inntekt, median (kr) | 2022 | 674000 |
| 287 | 3002 Moss (2020-2023) | 0000 Alle husholdninger | Samlet inntekt, median (kr) | 2022 | 707000 |
| 557 | 3003 Sarpsborg (2020-2023) | 0000 Alle husholdninger | Samlet inntekt, median (kr) | 2022 | 693000 |
| 827 | 3004 Fredrikstad (2020-2023) | 0000 Alle husholdninger | Samlet inntekt, median (kr) | 2022 | 706000 |
| 1097 | 3005 Drammen (2020-2023) | 0000 Alle husholdninger | Samlet inntekt, median (kr) | 2022 | 735000 |
def kommuneKode(text):
    return text[:4]

def kommuneNavn(text):

    end = text.rfind(' ')
    return text[5:end]


data_2022_allhousehold_totalincome['kommune kode'] = data_2022_allhousehold_totalincome['region'].map(kommuneKode)
data_2022_allhousehold_totalincome['kommune navn'] = data_2022_allhousehold_totalincome['region'].map(kommuneNavn)
data_2022_allhousehold_totalincome.head()| region | husholdningstype | statistikkvariabel | år | 06944: Inntekt for husholdninger, etter region, husholdningstype, statistikkvariabel og år | kommune kode | kommune navn | |
|---|---|---|---|---|---|---|---|
| 17 | 3001 Halden (2020-2023) | 0000 Alle husholdninger | Samlet inntekt, median (kr) | 2022 | 674000 | 3001 | Halden |
| 287 | 3002 Moss (2020-2023) | 0000 Alle husholdninger | Samlet inntekt, median (kr) | 2022 | 707000 | 3002 | Moss |
| 557 | 3003 Sarpsborg (2020-2023) | 0000 Alle husholdninger | Samlet inntekt, median (kr) | 2022 | 693000 | 3003 | Sarpsborg |
| 827 | 3004 Fredrikstad (2020-2023) | 0000 Alle husholdninger | Samlet inntekt, median (kr) | 2022 | 706000 | 3004 | Fredrikstad |
| 1097 | 3005 Drammen (2020-2023) | 0000 Alle husholdninger | Samlet inntekt, median (kr) | 2022 | 735000 | 3005 | Drammen |
len(data_2022_allhousehold_totalincome['kommune navn'].unique())388
SSB also offers map files download (https://kart.ssb.no/), here we downloaded
import geopandas as gpd

kommune = gpd.read_file('mv_kommunermednavn.shp')
kommune.head()| kommunenum | navn | geometry | |
|---|---|---|---|
| 0 | 4646 | Fjaler | POLYGON ((-20428.772 6832597.490, -20441.771 6... |
| 1 | 5049 | Flatanger | POLYGON ((263053.690 7172624.640, 263052.270 7... |
| 2 | 1511 | Vanylven | POLYGON ((1749.084 6921564.131, -1506.094 6925... |
| 3 | 3816 | Nome | POLYGON ((148567.840 6586720.610, 148429.240 6... |
| 4 | 4214 | Froland | POLYGON ((117922.071 6509638.209, 117937.491 6... |
Data Visualization
# Merge the data to the municipality shapfile
kommune_income = kommune.merge(data_2022_allhousehold_totalincome, left_on='kommunenum', right_on='kommune kode')
kommune_income.rename(columns={'06944: Inntekt for husholdninger, etter region, husholdningstype, statistikkvariabel og år':'inntekt'}, inplace=True)
kommune_income['inntekt'] = kommune_income['inntekt'].astype(float)

kommune_income.head()| kommunenum | navn | geometry | region | husholdningstype | statistikkvariabel | år | inntekt | kommune kode | kommune navn | |
|---|---|---|---|---|---|---|---|---|---|---|
| 0 | 4646 | Fjaler | POLYGON ((-20428.772 6832597.490, -20441.771 6... | 4646 Fjaler | 0000 Alle husholdninger | Samlet inntekt, median (kr) | 2022 | 626000.0 | 4646 | |
| 1 | 5049 | Flatanger | POLYGON ((263053.690 7172624.640, 263052.270 7... | 5049 Flatanger | 0000 Alle husholdninger | Samlet inntekt, median (kr) | 2022 | 747000.0 | 5049 | |
| 2 | 1511 | Vanylven | POLYGON ((1749.084 6921564.131, -1506.094 6925... | 1511 Vanylven | 0000 Alle husholdninger | Samlet inntekt, median (kr) | 2022 | 751000.0 | 1511 | |
| 3 | 3816 | Nome | POLYGON ((148567.840 6586720.610, 148429.240 6... | 3816 Nome (2020-2023) | 0000 Alle husholdninger | Samlet inntekt, median (kr) | 2022 | 682000.0 | 3816 | Nome |
| 4 | 3816 | Nome | POLYGON ((172731.930 6573204.140, 173183.050 6... | 3816 Nome (2020-2023) | 0000 Alle husholdninger | Samlet inntekt, median (kr) | 2022 | 682000.0 | 3816 | Nome |
Clearly to see rich Norwegians live on the west coast (where oil and gas industry is there) and capital region (Oslo).
import matplotlib.pyplot as plt

kommune_income.plot(column='inntekt', scheme="quantiles",figsize=(25, 15),legend=True,cmap='coolwarm')
plt.title('Househould Median Income in 2022 by Municipalities',fontsize=20)
plt.show()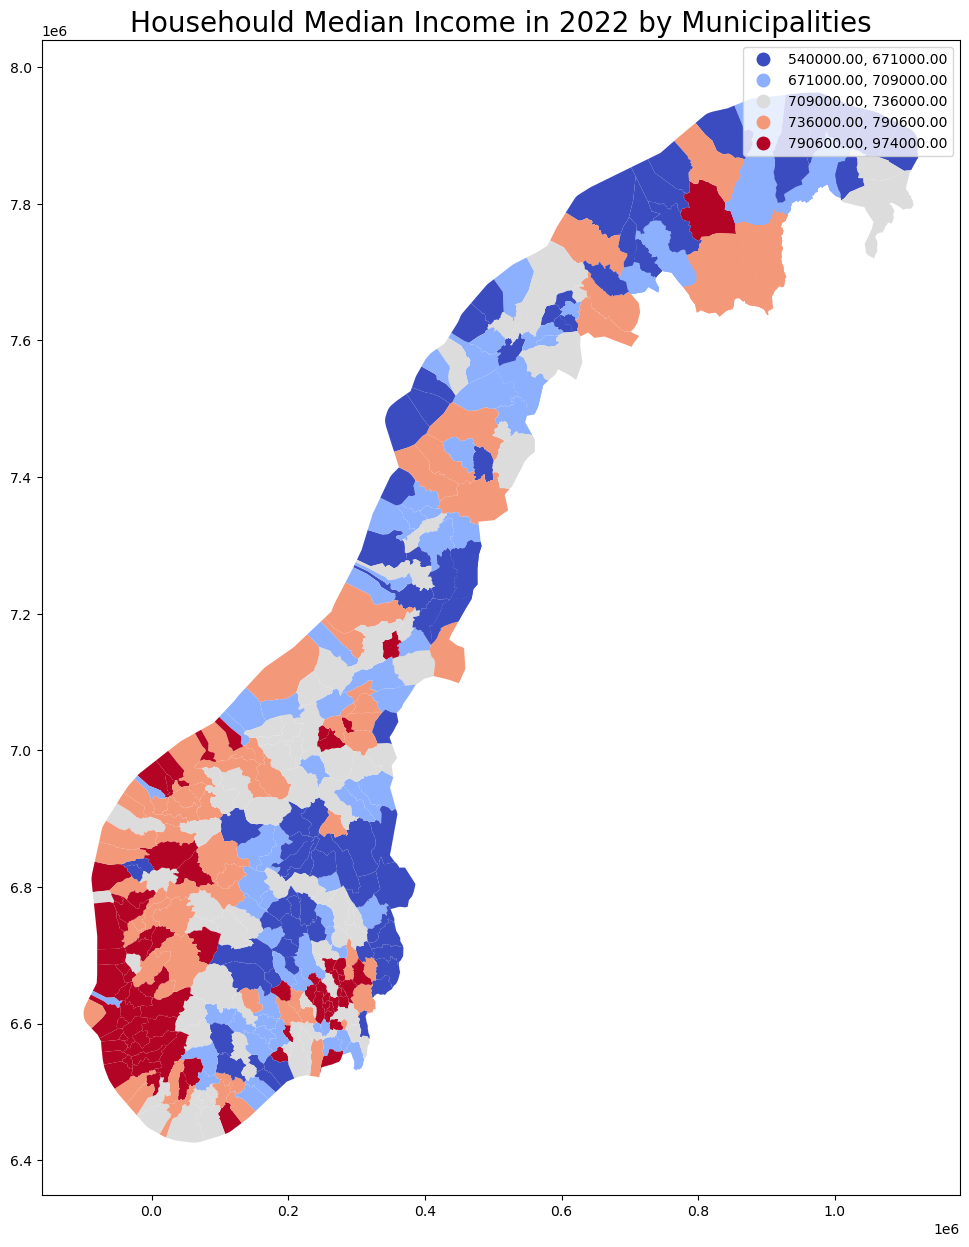
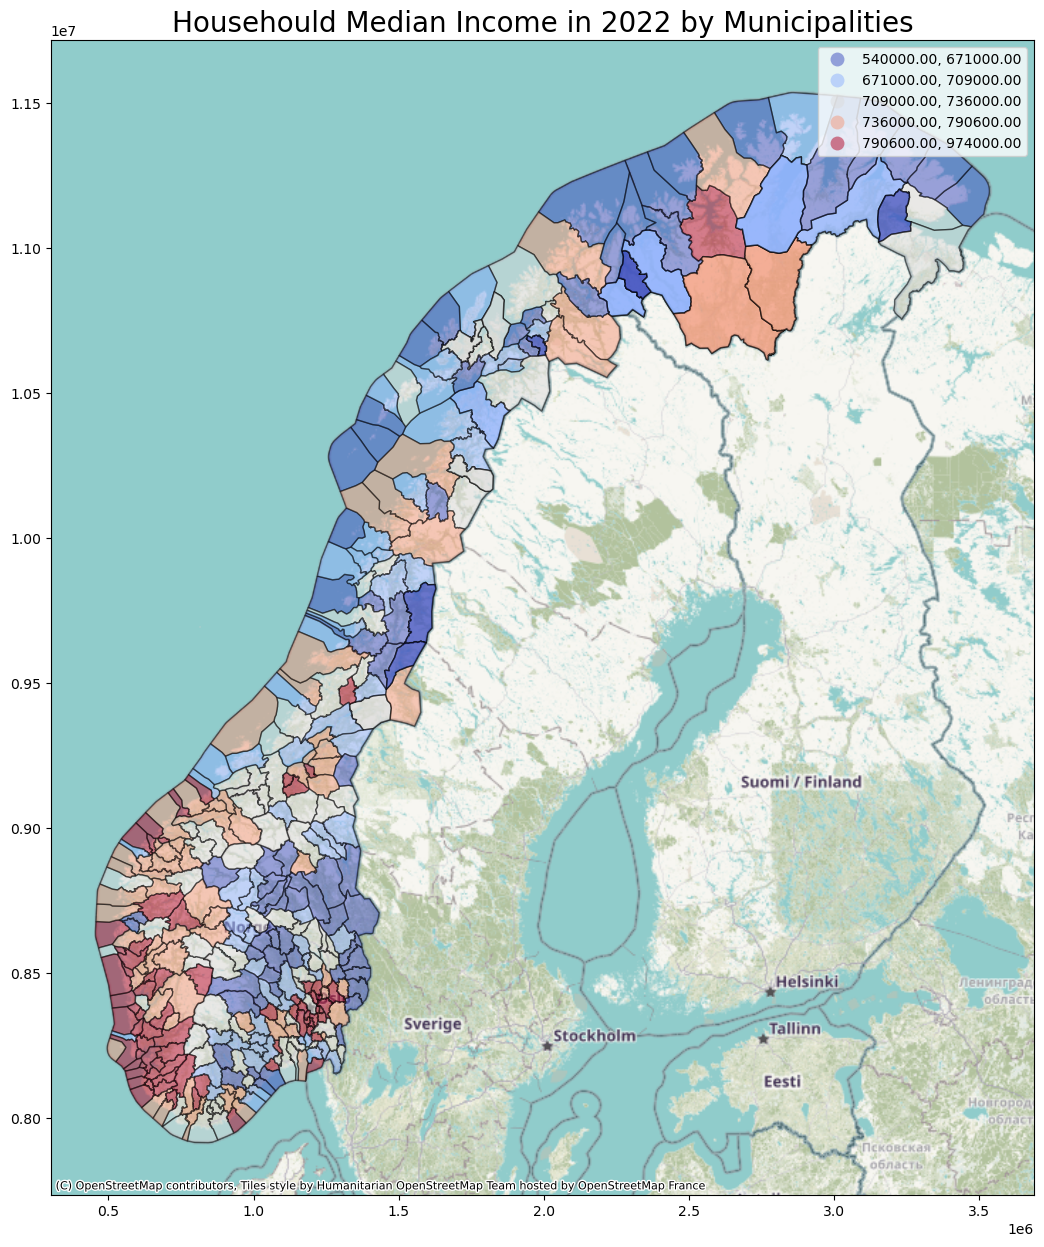
The Python module contextily could be used to add a background and make the map looks fancy.
import contextily as ctx
#Convert the data to Web Mercator
kommune_income_new = kommune_income.to_crs(epsg=3857)
ax = kommune_income_new.plot(column='inntekt',figsize=(25, 15), alpha=0.5, edgecolor='k' ,cmap='coolwarm',legend=True,scheme="quantiles")
#Add background tiles to plot
ctx.add_basemap(ax)
plt.title('Househould Median Income in 2022 by Municipalities',fontsize=20)
Text(0.5, 1.0, 'Househould Median Income in 2022 by Municipalities')