GeoPandas offers several datasets in GeoDataFrame format, which could be good examples for working with spatial vector data examinations.
# get the available datasets
import geopandas as gpd
import warnings
warnings.filterwarnings('ignore')

gpd.datasets.available
['naturalearth_cities', 'naturalearth_lowres', 'nybb']
# get the file for top cities in the world
city = gpd.read_file(gpd.datasets.get_path('naturalearth_cities'))

city.head()| name | geometry | |
|---|---|---|
| 0 | Vatican City | POINT (12.45339 41.90328) |
| 1 | San Marino | POINT (12.44177 43.93610) |
| 2 | Vaduz | POINT (9.51667 47.13372) |
| 3 | Lobamba | POINT (31.20000 -26.46667) |
| 4 | Luxembourg | POINT (6.13000 49.61166) |
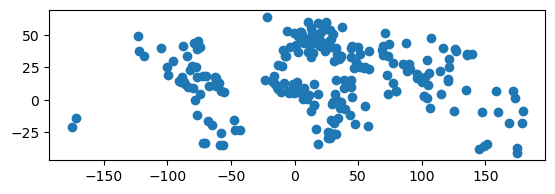
# plot the GeoDataFrame
city.plot()
<Axes: >

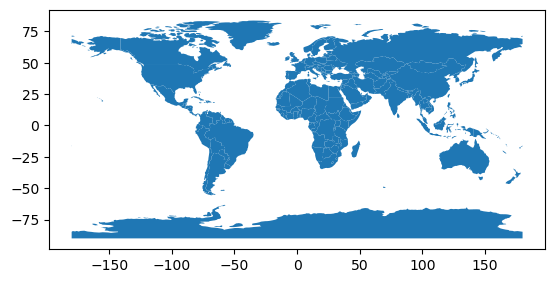
# get the GeoDataFrame for the whole world
world = gpd.read_file(gpd.datasets.get_path('naturalearth_lowres'))

world.head()| pop_est | continent | name | iso_a3 | gdp_md_est | geometry | |
|---|---|---|---|---|---|---|
| 0 | 889953.0 | Oceania | Fiji | FJI | 5496 | MULTIPOLYGON (((180.00000 -16.06713, 180.00000... |
| 1 | 58005463.0 | Africa | Tanzania | TZA | 63177 | POLYGON ((33.90371 -0.95000, 34.07262 -1.05982... |
| 2 | 603253.0 | Africa | W. Sahara | ESH | 907 | POLYGON ((-8.66559 27.65643, -8.66512 27.58948... |
| 3 | 37589262.0 | North America | Canada | CAN | 1736425 | MULTIPOLYGON (((-122.84000 49.00000, -122.9742... |
| 4 | 328239523.0 | North America | United States of America | USA | 21433226 | MULTIPOLYGON (((-122.84000 49.00000, -120.0000... |
world.plot()<Axes: >

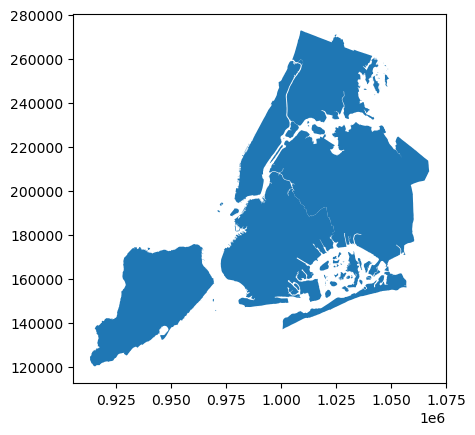
# get the file for New York boroughs
ny = gpd.read_file(gpd.datasets.get_path('nybb'))

ny.head()| BoroCode | BoroName | Shape_Leng | Shape_Area | geometry | |
|---|---|---|---|---|---|
| 0 | 5 | Staten Island | 330470.010332 | 1.623820e+09 | MULTIPOLYGON (((970217.022 145643.332, 970227.... |
| 1 | 4 | Queens | 896344.047763 | 3.045213e+09 | MULTIPOLYGON (((1029606.077 156073.814, 102957... |
| 2 | 3 | Brooklyn | 741080.523166 | 1.937479e+09 | MULTIPOLYGON (((1021176.479 151374.797, 102100... |
| 3 | 1 | Manhattan | 359299.096471 | 6.364715e+08 | MULTIPOLYGON (((981219.056 188655.316, 980940.... |
| 4 | 2 | Bronx | 464392.991824 | 1.186925e+09 | MULTIPOLYGON (((1012821.806 229228.265, 101278... |
ny.plot()<Axes: >


