Legend gives a lot of meaning to a visualization, offers explanation for the various plot elements.
%matplotlib inline
import warnings
warnings.filterwarnings('ignore')
import numpy as np
import matplotlib.pyplot as plt
plt.style.use('seaborn-whitegrid')
x = np.linspace(0,10,1000)
fig, ax = plt.subplots()
ax.plot(x, np.sin(x), '-b', label='Sine')
ax.plot(x, np.cos(x), '--r', label='Cosine')
ax.axis('equal')
leg = ax.legend()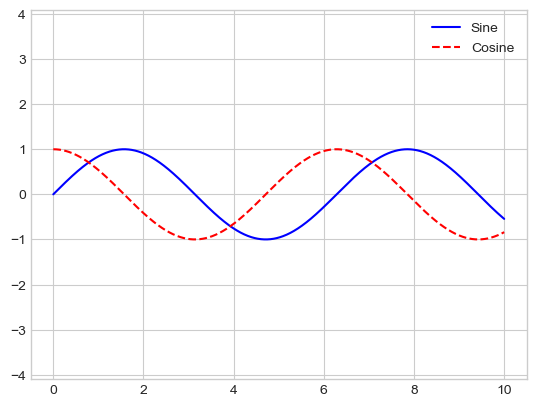
# specify the location and turn on the frame
ax.legend(loc='upper left', frameon=True)
fig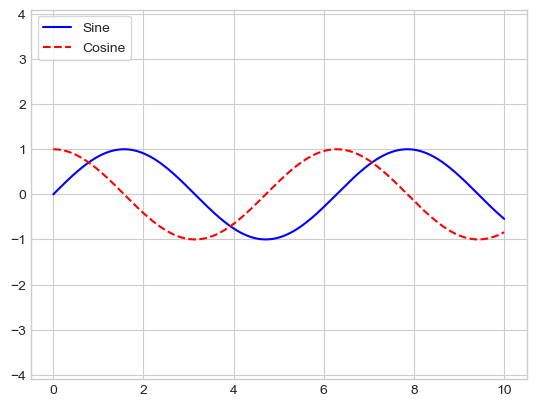
# specify the number of columns in the legend
ax.legend(loc='lower center', ncol=2)
fig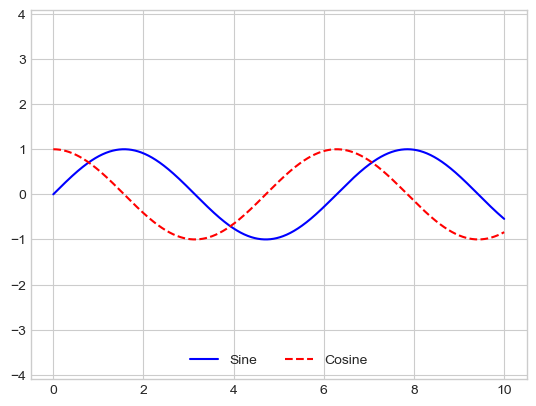
# use fancybox for customized frame
ax.legend(frameon=True, fancybox=True, framealpha=1, shadow=True, borderpad=1)
fig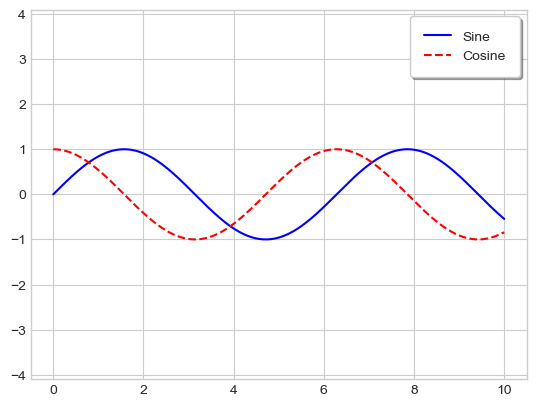
Reference
Python Data Science Handbook - Jake VanderPlas


