Error bars can be used to represent the variability of data and indicate the error or uncertanty in a reported measurement. They give a general idea of how far from the reported value the actual value might be.
Error bars often represent one standard deviation of uncertainty, one standard error, or a particular confidence interval (i.e. a 95% interval).
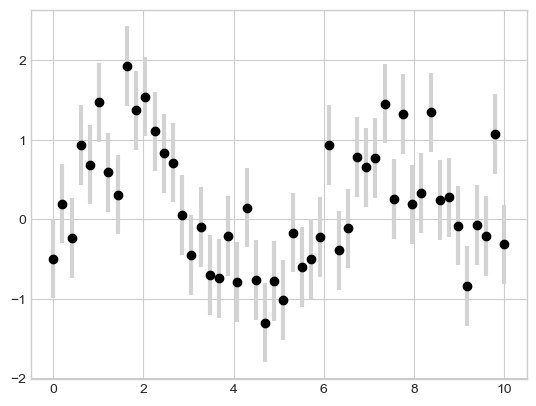
Simple Errorbars
Matplotlib function errorbar could be used to create a basic errorbar.
fmt defines the format of the data points/data lines, details about the parameters could be found here
%matplotlib inline
import numpy as np
import matplotlib.pyplot as plt
plt.style.use('seaborn-whitegrid')
import warnings
warnings.filterwarnings('ignore')
x = np.linspace(0,10,50)
dy = 0.5
y = np.sin(x) + dy*np.random.randn(50)
plt.errorbar(x, y, yerr=dy, fmt='o', color='black',
ecolor='lightgray', elinewidth=3, capsize=0)<ErrorbarContainer object of 3 artists>
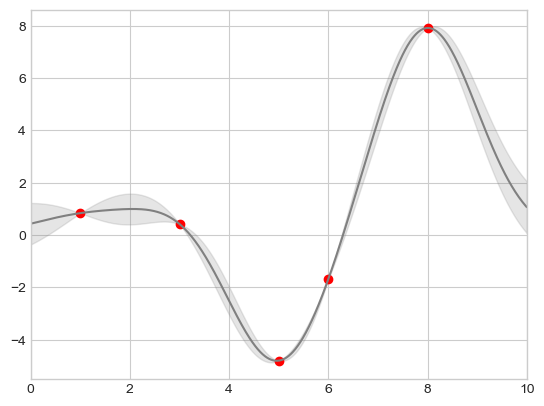
Continuous Errors
Simple errorbar plot above only shows constant quantities, in some situations errorbars on continuous quantities are desirable to show, this could be achieved by using Matplotlib functions plot and fill_between.
from sklearn.gaussian_process import GaussianProcessRegressor

# define the model
model = lambda x:x*np.sin(x)
xdata = np.array([1,3,5,6,8])
ydata = model(xdata)

# compute the Gaussion process fit
gp = GaussianProcessRegressor()
gp.fit(xdata[:, np.newaxis], ydata)

xfit = np.linspace(0,10,1000)
yfit, dyfit = gp.predict(xfit[:, np.newaxis], return_std=True)

# visualize the results
plt.plot(xdata, ydata, 'or')
plt.plot(xfit, yfit, '-', color='gray')
plt.fill_between(xfit, yfit-dyfit, yfit+dyfit, color='gray', alpha=0.2)
plt.xlim(0,10)
(0.0, 10.0)
Reference
Python Data Science Handbook - Jake VanderPlas