Contours or color-coded regions could be useful to visualize three-dimensional data in two dimensions. Matplotlib provides several functions for this task: contour for contour plots, contourf for filled countour plots
%matplotlib inline
import numpy as np
import matplotlib.pyplot as plt
plt.style.use('seaborn-whitegrid')
import warnings
warnings.filterwarnings('ignore')
Line-only countour plot
# define a three-dimensional function
def f(x,y):
    return np.sin(x)**10 + np.cos(10+y*x)*np.cos(x)
# generate three grids of x,y,z values
x = np.linspace(0,5,50)
y = np.linspace(0,5,40)
X,Y = np.meshgrid(x,y)
Z = f(X,Y)
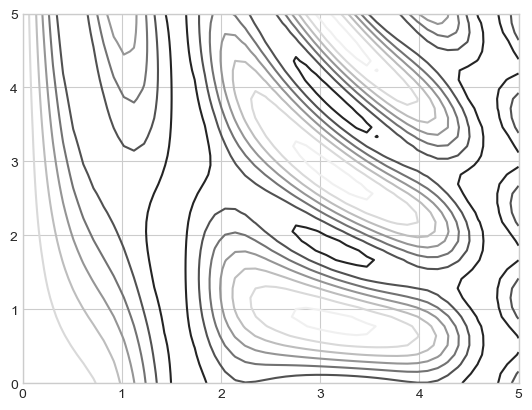
# plot a standard line-only contour
plt.contour(X,Y,Z, color='black')<matplotlib.contour.QuadContourSet at 0x1ac793fff90>
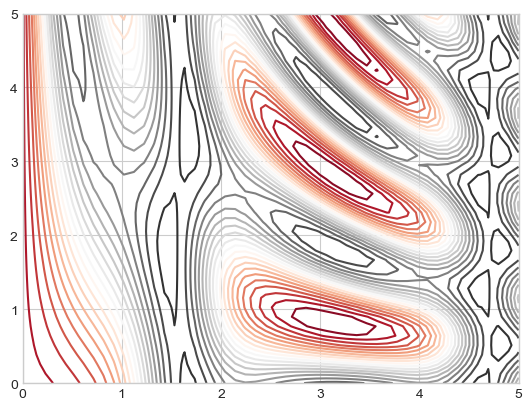
Single-color countour
A colormap using cmap argument could be used to specify color-coded lines.
plt.contour(X,Y,Z, 20, cmap='RdGy')<matplotlib.contour.QuadContourSet at 0x1ac79caf990>
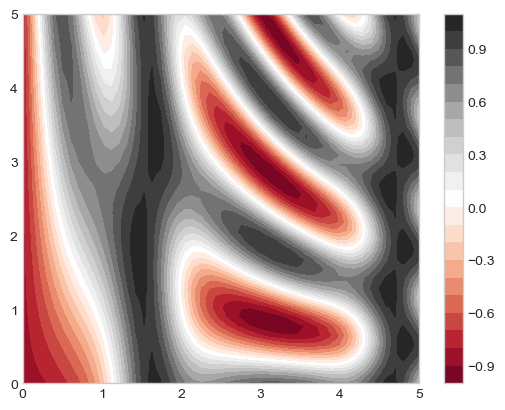
Filled ountour plot with contourf
colorbar is used to create an additional axis with labeled color information for the plot.
plt.contourf(X,Y,Z, 20, cmap='RdGy')
plt.colorbar()
<matplotlib.colorbar.Colorbar at 0x1ac79470350>
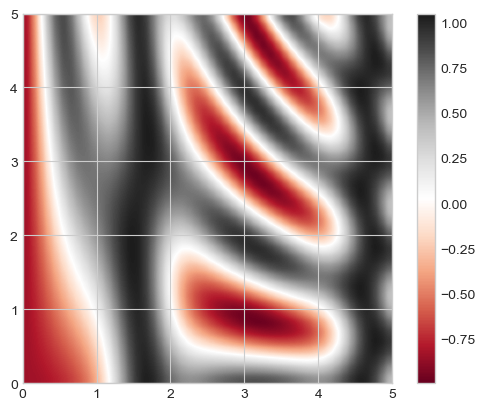
# enable countinuous color step
plt.imshow(Z, extent=[0,5,0,5], origin='lower', cmap='RdGy', interpolation='gaussian', aspect='equal')
plt.colorbar()
<matplotlib.colorbar.Colorbar at 0x1ac7954fdd0>
# use another interpolation method
plt.imshow(Z, extent=[0,5,0,5], origin='lower', cmap='RdGy', interpolation='hermite', aspect='equal')
plt.colorbar()
<matplotlib.colorbar.Colorbar at 0x1ac7e87bf50>

Reference
Python Data Science Handbook - Jake VanderPlas