Background
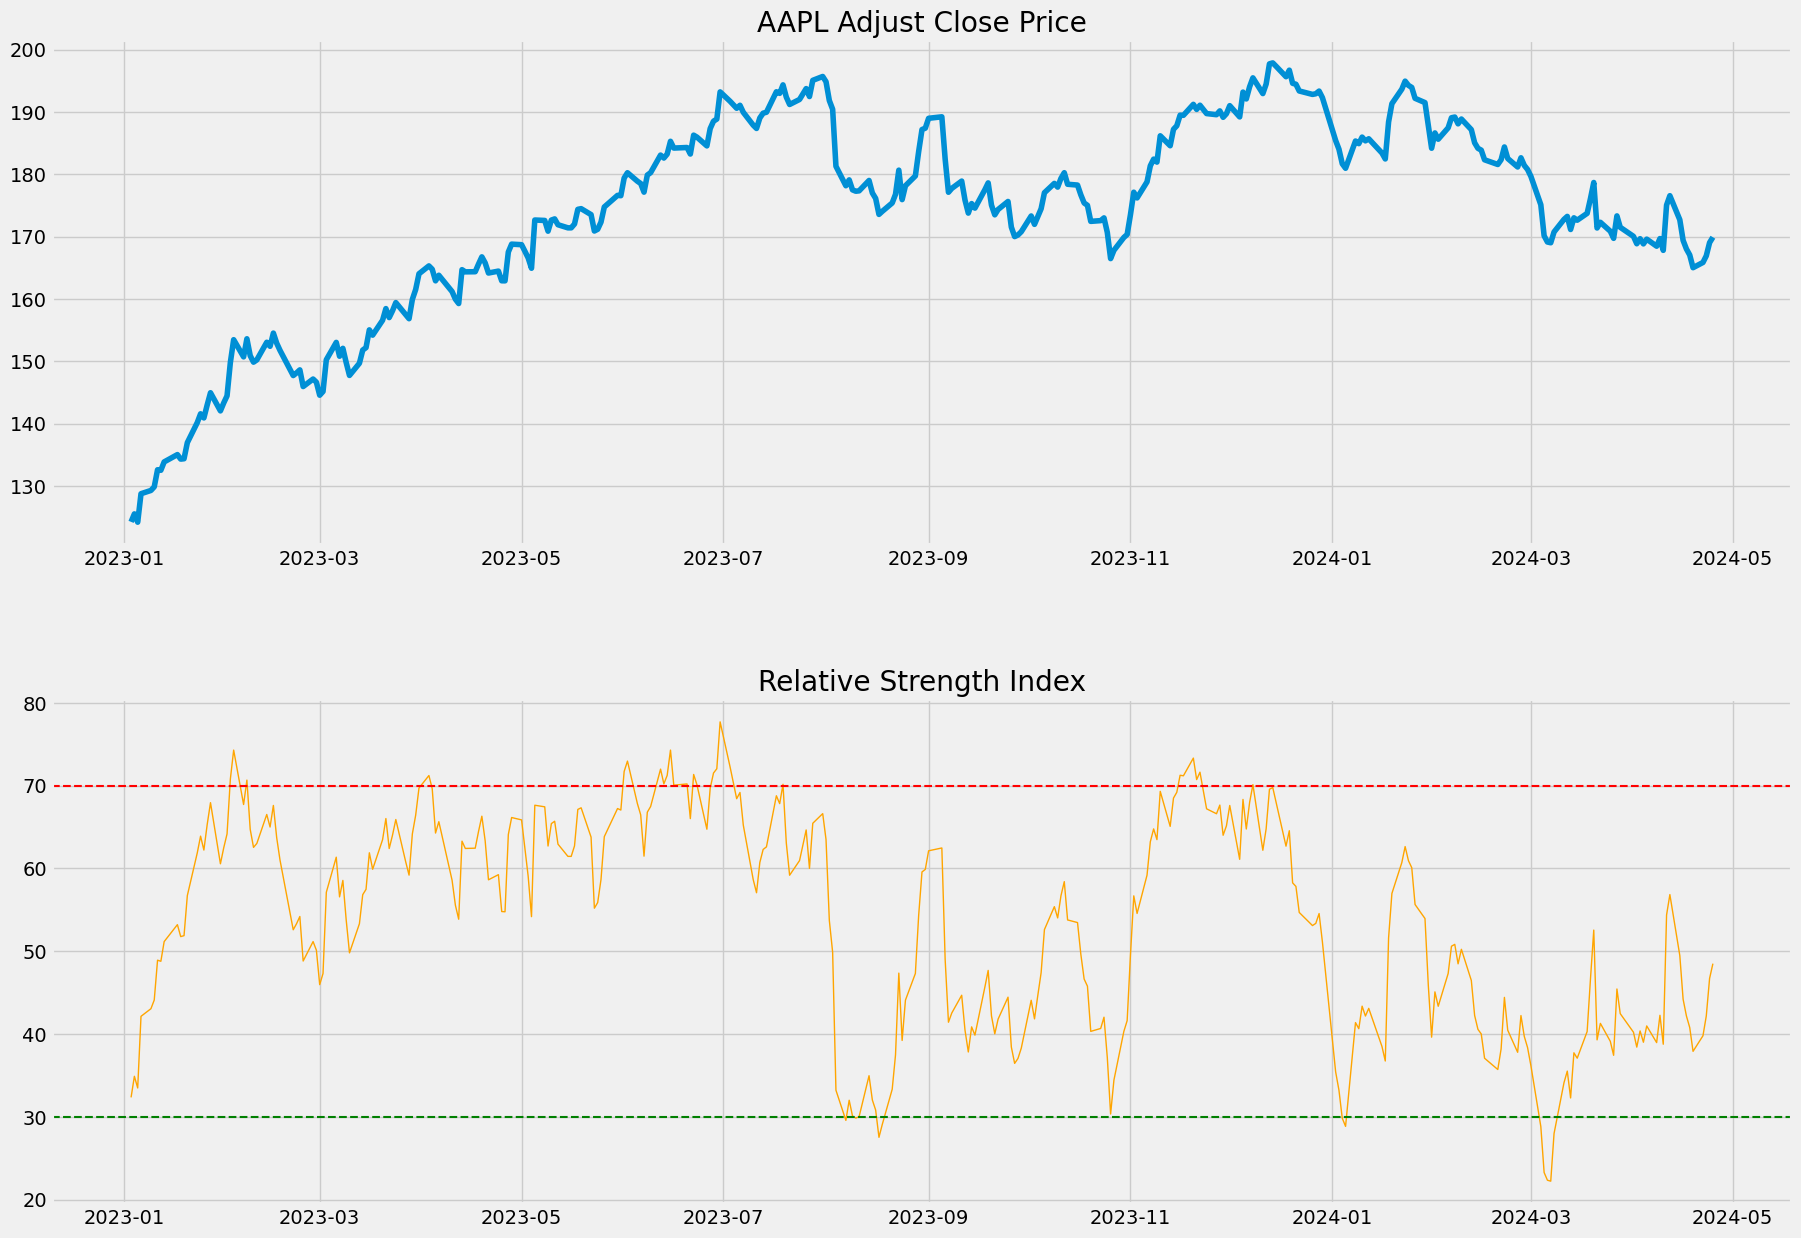
RSI is a momentum indicator that measures the speed and magnitude of a security’s recent price changes to evaluate overvalued or undervalued conditions in the price of that security. It is displayed as an oscillator (a line graph) on a scale of zero to 100.
Besides the indication of overbought and oversold securities, RSI can also point securities that may be primed for a trend reversal or corrective pullback in price. Simply speaking, it can signal when to buy and sell. Traditionally, an RSI reading of 70 or above indicates an overbought situation. A reading of 30 or below indicates an oversold condition.
Python implemenation
import pandas as pd
import sqlite3

# load S&P500 data from stored database
sp500_db = sqlite3.connect(database="sp500_data.sqlite")

df = pd.read_sql_query(sql="SELECT * FROM SP500",
                       con=sp500_db,
                       parse_dates={"Date"})
df.head()| level_0 | index | Date | Ticker | Adj Close | Close | High | Low | Open | Volume | garmin_klass_vol | rsi | |
|---|---|---|---|---|---|---|---|---|---|---|---|---|
| 0 | 0 | 0 | 2014-04-29 | A | 35.049534 | 38.125893 | 38.304722 | 37.174534 | 38.118740 | 4688612.0 | -0.002274 | NaN |
| 1 | 1 | 1 | 2014-04-29 | AAL | 33.476742 | 35.509998 | 35.650002 | 34.970001 | 35.200001 | 8994200.0 | -0.000788 | NaN |
| 2 | 2 | 2 | 2014-04-29 | AAPL | 18.633333 | 21.154642 | 21.285000 | 21.053928 | 21.205000 | 337377600.0 | -0.006397 | NaN |
| 3 | 3 | 3 | 2014-04-29 | ABBV | 34.034985 | 51.369999 | 51.529999 | 50.759998 | 50.939999 | 5601300.0 | -0.062705 | NaN |
| 4 | 4 | 4 | 2014-04-29 | ABT | 31.831518 | 38.540001 | 38.720001 | 38.259998 | 38.369999 | 4415600.0 | -0.013411 | NaN |
import pandas_ta

# calculate relative strength index
df['rsi'] = df.groupby(by='Ticker')['Adj Close'].transform(lambda x: pandas_ta.rsi(close=x, length=14))
aapl = df[df['Ticker'] == 'AAPL'].set_index('Date').drop('index',axis=1)
aapl.tail()| level_0 | Ticker | Adj Close | Close | High | Low | Open | Volume | garmin_klass_vol | rsi | |
|---|---|---|---|---|---|---|---|---|---|---|
| Date | ||||||||||
| 2024-04-19 | 1229877 | AAPL | 165.000000 | 165.000000 | 166.399994 | 164.080002 | 166.210007 | 67772100.0 | 0.000078 | 37.902497 |
| 2024-04-22 | 1230380 | AAPL | 165.839996 | 165.839996 | 167.259995 | 164.770004 | 165.520004 | 48116400.0 | 0.000111 | 39.784337 |
| 2024-04-23 | 1230883 | AAPL | 166.899994 | 166.899994 | 167.050003 | 164.919998 | 165.350006 | 49537800.0 | 0.000049 | 42.166124 |
| 2024-04-24 | 1231386 | AAPL | 169.020004 | 169.020004 | 169.300003 | 166.210007 | 166.539993 | 48251800.0 | 0.000085 | 46.706439 |
| 2024-04-25 | 1231889 | AAPL | 169.889999 | 169.889999 | 170.610001 | 168.149994 | 169.529999 | 50558300.0 | 0.000104 | 48.493460 |
# update the database
df.drop('level_0', axis=1).to_sql(name="SP500",
          con=sp500_db,
          if_exists="replace",
          index=True)
sp500_db.close()
import matplotlib.pyplot as plt
from datetime import datetime
# only select the data from 2023-01-01
aapl_new = aapl[aapl.index > datetime(2023,1,1)]
# set the theme of the chart
plt.style.use('fivethirtyeight')
plt.rcParams['figure.figsize'] = (20,16)
# create two charts on the same figure
ax1 = plt.subplot2grid((10,1),(0,0), rowspan=4, colspan=1)
ax2 = plt.subplot2grid((10,1),(5,0), rowspan=4, colspan=1)
# plot the closing price on the first chart
ax1.plot(aapl_new['Adj Close'])
ax1.set_title('AAPL Adjust Close Price')
# plot the RSI on the second chart
ax2.plot(aapl_new['rsi'], color='orange', linewidth=1)
ax2.set_title('Relative Strength Index')
# add two horizontal lines, signaling the buy and sell ranges
# oversold
ax2.axhline(30, linestyle='--', linewidth=1.5, color='green')
# overbought
ax2.axhline(70, linestyle='--', linewidth=1.5, color='red')<matplotlib.lines.Line2D at 0x183fbdf2a10>

Discussion
Overbought or oversold
Generally, when the RSI indicator crosses 30 on the RSI chart (refer above), it is a bullish sign and when it crosses 70, it is a bearish sign. Therefore when the RSI values are 70 or above, it indicates the security is becoming overbought or overvalued, on the other hand, if an RSI value is 30 or below, it is interpreted that the security is oversold or undervalued.
Uptrend and downtrend
During an uptrend, the RSI tends to stay above 30 and should frequently hit 70. During a downtrend, it is rare to see the RSI exceed 70, and it frequently hits 30 or below.
Limitation
The RSI’s signals are most reliable when they conform to the long-term trend.
True reversal signals are rare and can be difficult to separate from false alarms.
The RSI is most useful in an oscillating market where the asset price is alternating between bullish and bearish movements.
Reference
Relative Strength Index (RSI) Indicator Explained With Formula by JASON FERNANDO


