Background
Moving average convergence/divergence (MACD) is a technical indicator to help investors identify price trends, measure trend momentum, and identify market entry points for buying and selling, it shows the relationship between two exponential moving averages (EMAs) of a security’s price.
The MACD line is calculated by subtracting the 26-period EMA from the 12-period EMA. A 9-day EMA of the MACD line is called the signal line, plotted on top of the MACD line, which can function as a trigger for buy or sell signals. When the MACD line crosses above the signal line it indicates a buy signal, when the MACD line crosses below the signal line it is the sell signal.
Python Implementation
import pandas as pd
import sqlite3

# load S&P500 data from stored database
sp500_db = sqlite3.connect(database="sp500_data.sqlite")

df = pd.read_sql_query(sql="SELECT * FROM SP500",
                       con=sp500_db,
                       parse_dates={"Date"})
df.head()| index | Date | Ticker | Adj Close | Close | High | Low | Open | Volume | garmin_klass_vol | rsi | atr | |
|---|---|---|---|---|---|---|---|---|---|---|---|---|
| 0 | 0 | 2014-04-29 | A | 35.049534 | 38.125893 | 38.304722 | 37.174534 | 38.118740 | 4688612.0 | -0.002274 | NaN | NaN |
| 1 | 1 | 2014-04-29 | AAL | 33.476742 | 35.509998 | 35.650002 | 34.970001 | 35.200001 | 8994200.0 | -0.000788 | NaN | NaN |
| 2 | 2 | 2014-04-29 | AAPL | 18.633333 | 21.154642 | 21.285000 | 21.053928 | 21.205000 | 337377600.0 | -0.006397 | NaN | NaN |
| 3 | 3 | 2014-04-29 | ABBV | 34.034985 | 51.369999 | 51.529999 | 50.759998 | 50.939999 | 5601300.0 | -0.062705 | NaN | NaN |
| 4 | 4 | 2014-04-29 | ABT | 31.831518 | 38.540001 | 38.720001 | 38.259998 | 38.369999 | 4415600.0 | -0.013411 | NaN | NaN |
# remove irrelevant columns
df = df.drop('index', axis=1)
df.head()| Date | Ticker | Adj Close | Close | High | Low | Open | Volume | garmin_klass_vol | rsi | atr | |
|---|---|---|---|---|---|---|---|---|---|---|---|
| 0 | 2014-04-29 | A | 35.049534 | 38.125893 | 38.304722 | 37.174534 | 38.118740 | 4688612.0 | -0.002274 | NaN | NaN |
| 1 | 2014-04-29 | AAL | 33.476742 | 35.509998 | 35.650002 | 34.970001 | 35.200001 | 8994200.0 | -0.000788 | NaN | NaN |
| 2 | 2014-04-29 | AAPL | 18.633333 | 21.154642 | 21.285000 | 21.053928 | 21.205000 | 337377600.0 | -0.006397 | NaN | NaN |
| 3 | 2014-04-29 | ABBV | 34.034985 | 51.369999 | 51.529999 | 50.759998 | 50.939999 | 5601300.0 | -0.062705 | NaN | NaN |
| 4 | 2014-04-29 | ABT | 31.831518 | 38.540001 | 38.720001 | 38.259998 | 38.369999 | 4415600.0 | -0.013411 | NaN | NaN |
# remove GEV and SOLV which were newly added (no sufficient data for MACD calculation)
df = df.drop(df[(df['Ticker'] =='GEV') | (df['Ticker'] == 'SOLV')].index)
import pandas_ta
# calculate MACD
def compute_macd(close):
macd = pandas_ta.macd(close=close, length=20).iloc[:,0]
return macd.sub(macd.mean()).div(macd.std())
# calculate MACD signal
def compute_macd_signal(close):
macd_signal = pandas_ta.macd(close=close, length=20).iloc[:,2]
return macd_signal.sub(macd_signal.mean()).div(macd_signal.std())
df = df.set_index(['Date', 'Ticker'])
df['macd'] = df.groupby(level=1, group_keys=False)['Adj Close'].apply(compute_macd)
df['macd signal'] = df.groupby(level=1, group_keys=False)['Adj Close'].apply(compute_macd_signal)
df.tail()| Adj Close | Close | High | Low | Open | Volume | garmin_klass_vol | rsi | atr | macd | macd signal | ||
|---|---|---|---|---|---|---|---|---|---|---|---|---|
| Date | Ticker | |||||||||||
| 2024-04-25 | XYL | 130.610001 | 130.610001 | 131.199997 | 128.100006 | 129.619995 | 963600.0 | 0.000264 | 61.482745 | 0.665306 | 0.355146 | 0.255276 |
| YUM | 141.559998 | 141.559998 | 142.169998 | 140.389999 | 141.979996 | 1693100.0 | 0.000076 | 65.668163 | 0.322566 | 0.550830 | 0.285784 | |
| ZBH | 119.750000 | 119.750000 | 121.349998 | 118.769997 | 120.709999 | 1078800.0 | 0.000206 | 35.636078 | -0.350196 | -0.889200 | -0.646480 | |
| ZBRA | 292.529999 | 292.529999 | 293.290009 | 271.630005 | 274.359985 | 674700.0 | 0.001355 | 56.172272 | 0.500501 | -0.391439 | -0.242456 | |
| ZTS | 153.360001 | 153.360001 | 153.589996 | 150.039993 | 150.970001 | 4567200.0 | 0.000178 | 39.809619 | 1.374957 | -3.202379 | -3.584353 |
# update the database
df = df.reset_index()
df.to_sql(name="SP500",
          con=sp500_db,
          if_exists="replace",
          index=True)
sp500_db.close()
from plotly.subplots import make_subplots
import plotly.graph_objects as go
import warnings
warnings.filterwarnings('ignore')
# select AAPL
aapl = df[df['Ticker'] == 'AAPL'].set_index('Date')
# only select the data from 2023-01-01
aapl_new = aapl[aapl.index > datetime(2023,1,1)]
aapl_new['macd histogram'] = aapl_new['macd'] - aapl['macd signal']
# create a plotly figure
fig = make_subplots(rows=2, cols=1)
# adjust close
fig.add_trace(go.Scatter(x=aapl_new.index, y=aapl_new['Adj Close'], mode='lines', name='Adjust Close'), row=1, col=1)
# MACD and signal lines
fig.add_trace(go.Scatter(x=aapl_new.index, y=aapl_new['macd'], mode='lines', name='MACD'), row=2, col=1)
fig.add_trace(go.Scatter(x=aapl_new.index, y=aapl_new['macd signal'], mode='lines', name='MACD Signal'), row=2, col=1)
# histogram
fig.add_trace(go.Bar(x=aapl_new.index, y=aapl_new['macd histogram'], name='MACD Histogram',
marker_color=['green' if val >= 0 else 'red' for val in aapl_new['macd histogram']]), row=2, col=1)
# customize the chart
fig.update_xaxes(rangeslider=dict(visible=False))
fig.update_layout(plot_bgcolor='#efefff', font_size=10,width=900)
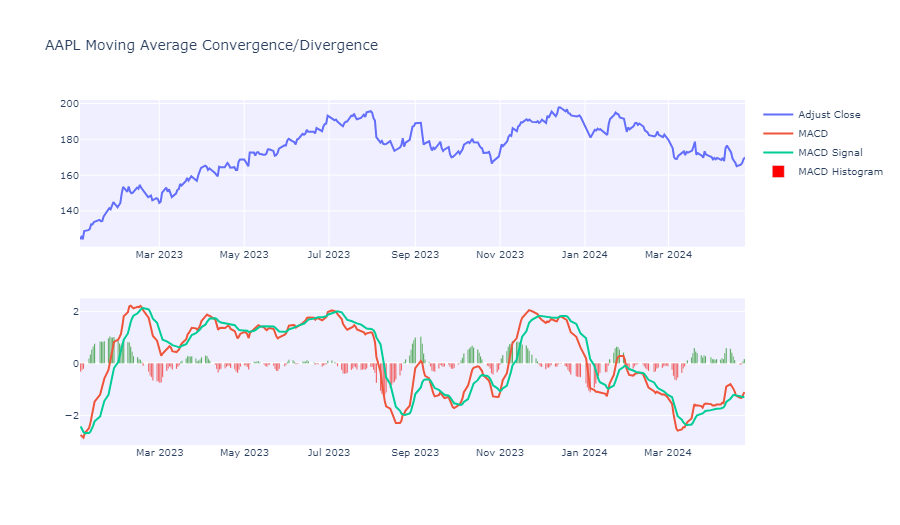
fig.update_layout(title="AAPL Moving Average Convergence/Divergence")
# show the chart
fig.show()
Reference
What is MACD? by Brian Dolan on Investopedia