Background
Ease of movement (EMV) is a technical analysis indicator that is related to an asset’s price change to its volume. High positive values indicate the price is increasing on low volume, strong negative values indicate the price is dropping on low volume. The moving average of the indicator can be added to act as a trigger line, which is similar to other indicators like MACD.
Theoretically, if prices move easily, they will continue to do so for a period of time that can be traded effectively. The EMV indicator fluctuates around a zero-line. When the indicator is above the line, in positive territory, prices are advancing with relative ease - the greater the value the greater the “ease”. Similarly, when the indicator is negative, prices are decling with relative ease depending on how negative.
Python Implementation
import pandas as pd
import sqlite3

# load S&P500 data from stored database
sp500_db = sqlite3.connect(database="sp500_data.sqlite")

df = pd.read_sql_query(sql="SELECT * FROM SP500",
                       con=sp500_db,
                       parse_dates={"Date"})
df.head()| index | Date | Ticker | level_0 | Adj Close | Close | High | Low | Open | Volume | ... | atr | macd | macd signal | bb_low | bb_mid | bb_high | sma | ema | ad | obv | |
|---|---|---|---|---|---|---|---|---|---|---|---|---|---|---|---|---|---|---|---|---|---|
| 0 | 0 | 2014-04-29 | A | 0 | 35.049534 | 38.125893 | 38.304722 | 37.174534 | 38.118740 | 4688612.0 | ... | NaN | NaN | NaN | NaN | NaN | NaN | NaN | NaN | 3.204858e+06 | 4688612.0 |
| 1 | 1 | 2014-04-29 | AAL | 1 | 33.476742 | 35.509998 | 35.650002 | 34.970001 | 35.200001 | 8994200.0 | ... | NaN | NaN | NaN | NaN | NaN | NaN | NaN | NaN | 5.290623e+06 | 8994200.0 |
| 2 | 2 | 2014-04-29 | AAPL | 2 | 18.633333 | 21.154642 | 21.285000 | 21.053928 | 21.205000 | 337377600.0 | ... | NaN | NaN | NaN | NaN | NaN | NaN | NaN | NaN | -4.328196e+07 | 337377600.0 |
| 3 | 3 | 2014-04-29 | ABBV | 3 | 34.034985 | 51.369999 | 51.529999 | 50.759998 | 50.939999 | 5601300.0 | ... | NaN | NaN | NaN | NaN | NaN | NaN | NaN | NaN | 3.273491e+06 | 5601300.0 |
| 4 | 4 | 2014-04-29 | ABT | 4 | 31.831518 | 38.540001 | 38.720001 | 38.259998 | 38.369999 | 4415600.0 | ... | NaN | NaN | NaN | NaN | NaN | NaN | NaN | NaN | 9.599290e+05 | 4415600.0 |
5 rows × 22 columns
# remove irrelevant columns
df = df.drop('index', axis=1)
#df = df.drop('level_0', axis=1)
df.head()| Date | Ticker | level_0 | Adj Close | Close | High | Low | Open | Volume | garmin_klass_vol | ... | atr | macd | macd signal | bb_low | bb_mid | bb_high | sma | ema | ad | obv | |
|---|---|---|---|---|---|---|---|---|---|---|---|---|---|---|---|---|---|---|---|---|---|
| 0 | 2014-04-29 | A | 0 | 35.049534 | 38.125893 | 38.304722 | 37.174534 | 38.118740 | 4688612.0 | -0.002274 | ... | NaN | NaN | NaN | NaN | NaN | NaN | NaN | NaN | 3.204858e+06 | 4688612.0 |
| 1 | 2014-04-29 | AAL | 1 | 33.476742 | 35.509998 | 35.650002 | 34.970001 | 35.200001 | 8994200.0 | -0.000788 | ... | NaN | NaN | NaN | NaN | NaN | NaN | NaN | NaN | 5.290623e+06 | 8994200.0 |
| 2 | 2014-04-29 | AAPL | 2 | 18.633333 | 21.154642 | 21.285000 | 21.053928 | 21.205000 | 337377600.0 | -0.006397 | ... | NaN | NaN | NaN | NaN | NaN | NaN | NaN | NaN | -4.328196e+07 | 337377600.0 |
| 3 | 2014-04-29 | ABBV | 3 | 34.034985 | 51.369999 | 51.529999 | 50.759998 | 50.939999 | 5601300.0 | -0.062705 | ... | NaN | NaN | NaN | NaN | NaN | NaN | NaN | NaN | 3.273491e+06 | 5601300.0 |
| 4 | 2014-04-29 | ABT | 4 | 31.831518 | 38.540001 | 38.720001 | 38.259998 | 38.369999 | 4415600.0 | -0.013411 | ... | NaN | NaN | NaN | NaN | NaN | NaN | NaN | NaN | 9.599290e+05 | 4415600.0 |
5 rows × 21 columns
import pandas_ta

df = df.set_index(['Date','Ticker'])

# compute EMV

def compute_emv(stock_data):
    emv = pandas_ta.eom(high=stock_data['High'],
                        low=stock_data['Low'],
                        close=stock_data['Close'],
                        volume=stock_data['Volume'],
                        length=14)
    return emv

df['emv'] = df.groupby(level=1, group_keys=False).apply(compute_emv)
df.tail()| level_0 | Adj Close | Close | High | Low | Open | Volume | garmin_klass_vol | rsi | atr | macd | macd signal | bb_low | bb_mid | bb_high | sma | ema | ad | obv | emv | ||
|---|---|---|---|---|---|---|---|---|---|---|---|---|---|---|---|---|---|---|---|---|---|
| Date | Ticker | ||||||||||||||||||||
| 2024-04-25 | XYL | 1232347 | 130.610001 | 130.610001 | 131.199997 | 128.100006 | 129.619995 | 963600.0 | 0.000264 | 61.482745 | 0.665306 | 0.355146 | 0.255276 | 4.845591 | 4.863502 | 4.881413 | 128.482000 | 128.582695 | 1.381747e+08 | 42359600.0 | -1.275613 |
| YUM | 1232348 | 141.559998 | 141.559998 | 142.169998 | 140.389999 | 141.979996 | 1693100.0 | 0.000076 | 65.668163 | 0.322566 | 0.550830 | 0.285784 | 4.913482 | 4.937968 | 4.962454 | 138.497000 | 138.658563 | 8.902989e+07 | 253995207.0 | 47.014878 | |
| ZBH | 1232349 | 119.750000 | 119.750000 | 121.349998 | 118.769997 | 120.709999 | 1078800.0 | 0.000206 | 35.636078 | -0.350196 | -0.889200 | -0.646480 | 4.772846 | 4.835888 | 4.898931 | 125.012999 | 123.565569 | 7.870077e+07 | -62096220.0 | -114.852947 | |
| ZBRA | 1232350 | 292.529999 | 292.529999 | 293.290009 | 271.630005 | 274.359985 | 674700.0 | 0.001355 | 56.172272 | 0.500501 | -0.391439 | -0.242456 | 5.588730 | 5.666387 | 5.744044 | 288.205502 | 284.262362 | 5.349014e+07 | 37474700.0 | -2359.322092 | |
| ZTS | 1232351 | 153.360001 | 153.360001 | 153.589996 | 150.039993 | 150.970001 | 4567200.0 | 0.000178 | 39.809619 | 1.374957 | -3.202379 | -3.584353 | 4.967408 | 5.065065 | 5.162723 | 157.579352 | 157.003521 | 2.636284e+08 | 255609600.0 | -95.499616 |
# update the database
df = df.reset_index()
df.to_sql(name="SP500",
          con=sp500_db,
          if_exists="replace",
          index=True)
sp500_db.close()
import matplotlib.pyplot as plt
from datetime import datetime
# select AAPL
aapl = df[df['Ticker'] == 'AAPL'].set_index('Date')
# only select the data from 2022-01-01
aapl_new = aapl[aapl.index > datetime(2022,1,1)]
# set the theme of the chart
plt.style.use('fivethirtyeight')
plt.rcParams['figure.figsize'] = (20,16)
# create two charts on the same figure
ax1 = plt.subplot2grid((10,1),(0,0), rowspan=4, colspan=1)
ax2 = plt.subplot2grid((10,1),(5,0), rowspan=4, colspan=1)
# plot the closing price on the first chart
ax1.plot(aapl_new['Adj Close'])
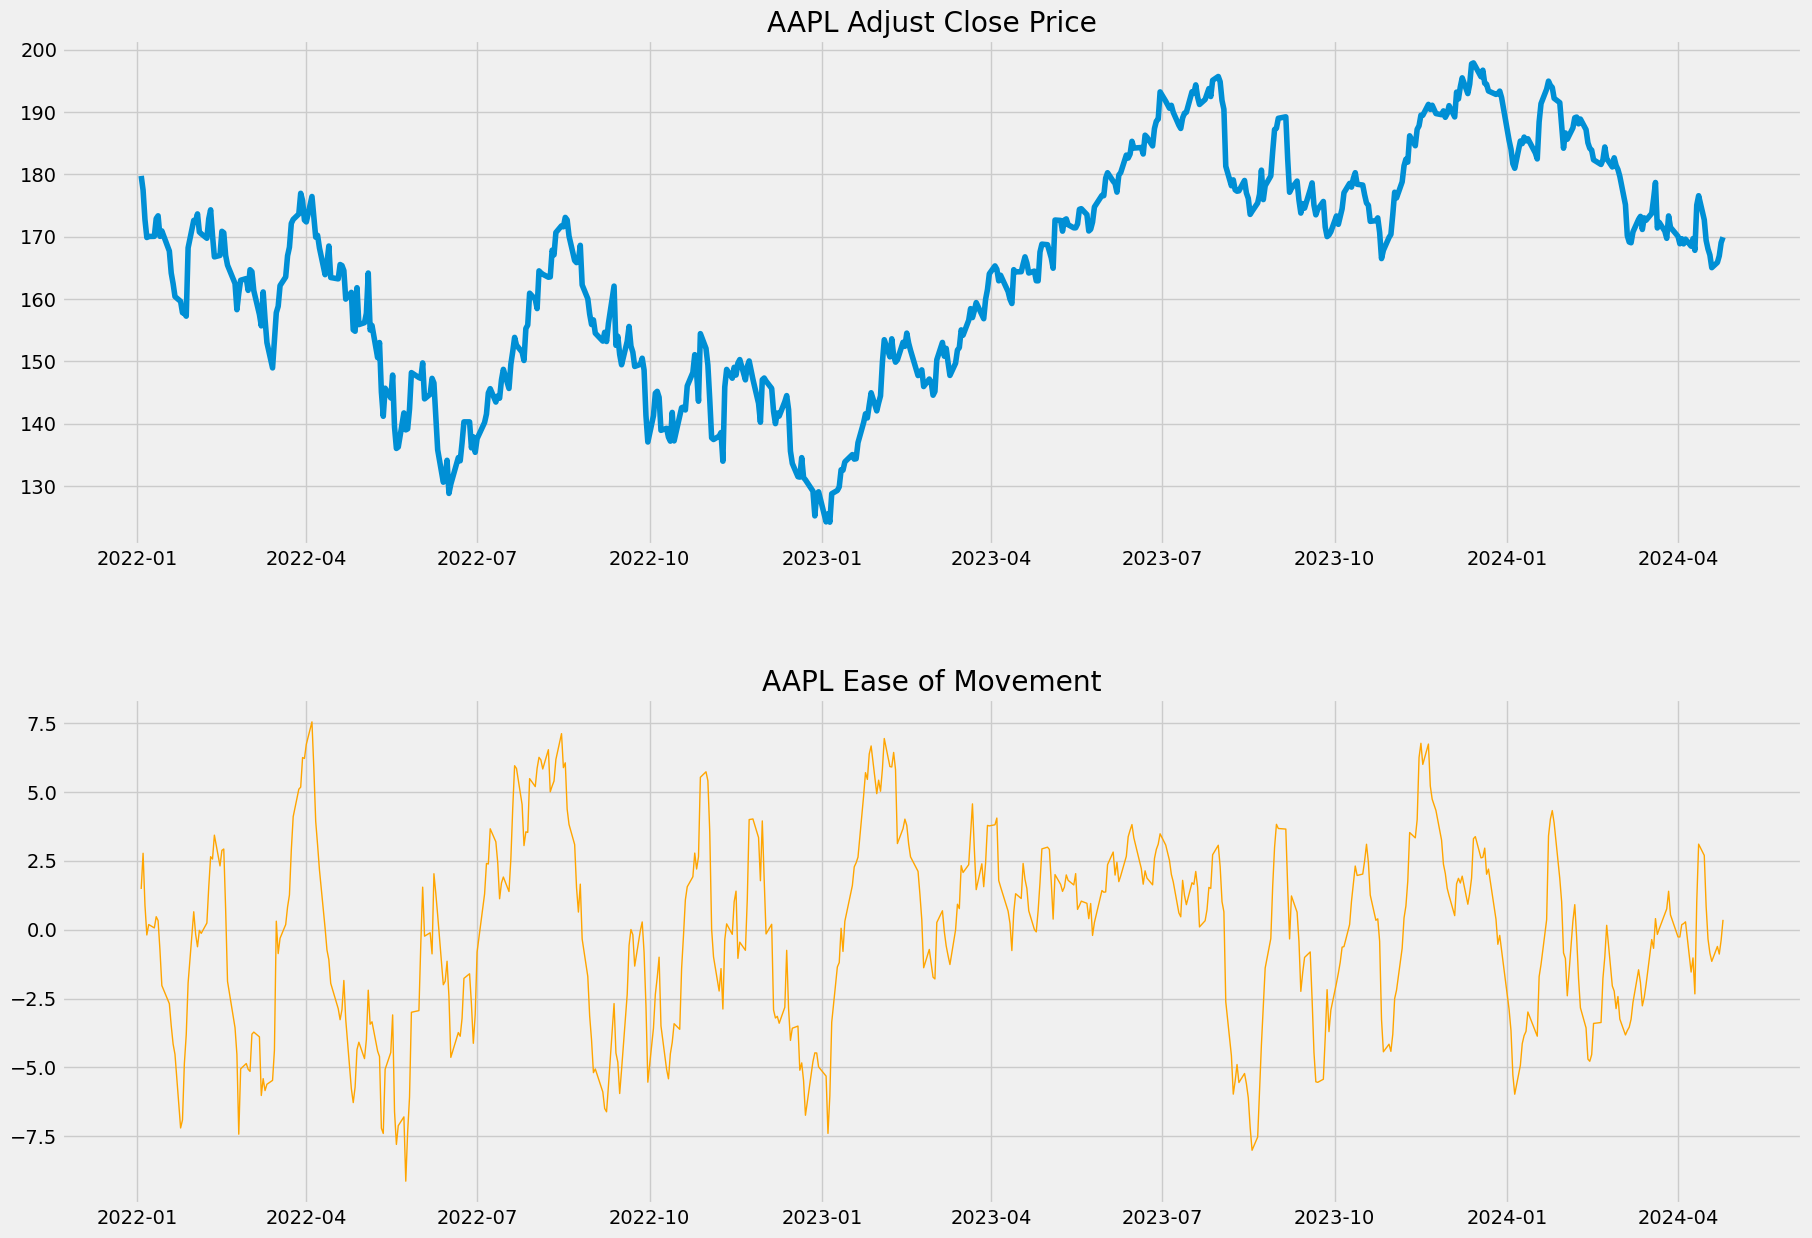
ax1.set_title('AAPL Adjust Close Price')
# plot the EMV on the second chart
ax2.plot(aapl_new['emv'], color='orange', linewidth=1)
ax2.set_title('AAPL Ease of Movement')Text(0.5, 1.0, 'AAPL Ease of Movement')
Reference
Ease of Movement Indicator: Overview, Formula, FAQ by Gordon Scott on Investopedia